Read in “fungicide.tidy”
> fungicide.tidy <- read.csv("data/FungicideTidy.csv", head = TRUE)Make a simple X-Y graph
> plot(fungicide.tidy$Severity ~ fungicide.tidy$Julian.Date)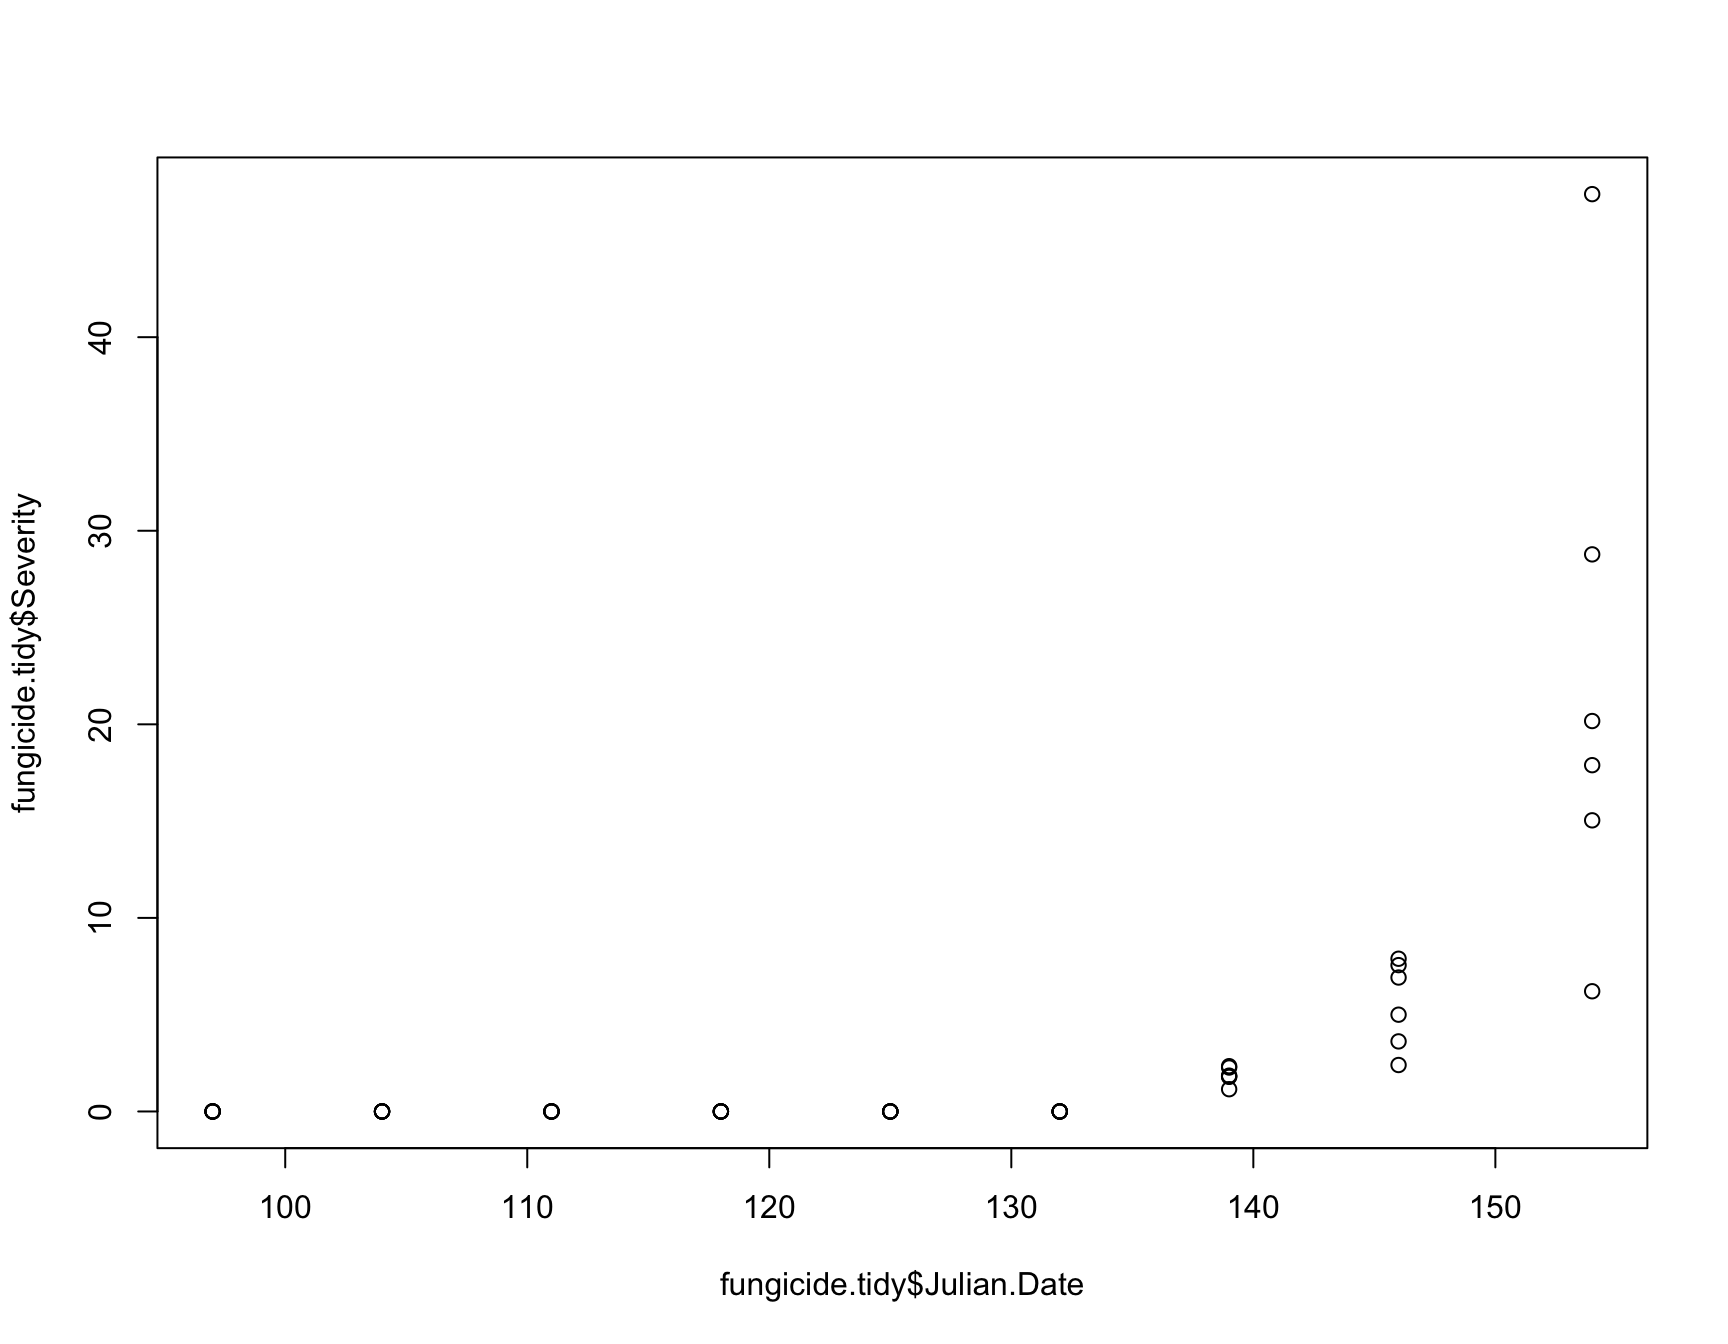
Label the X- and Y- Axes
> plot(fungicide.tidy$Severity ~ fungicide.tidy$Julian.Date, xlab = "Julian Date", ylab = "Disease Severity", main = "Disease Severity",
+      cex.lab = 1.5, cex.main = 2)
Make a simple X-Y graph, where the symbols differ for “control” and “fungicide”
> color.vector <- rep("purple", nrow(fungicide.tidy))
> color.vector[which(fungicide.tidy$Experiment == "control" )] <- "red"
>
> symbol.vector <- rep(25, nrow(fungicide.tidy))
> symbol.vector[which(fungicide.tidy$Experiment == "control" )] <- 24
>
> plot(fungicide.tidy$Severity ~ fungicide.tidy$Julian.Date, xlab = "Julian Date", ylab = "Disease Severity", main = "Disease Severity",
+      cex.lab = 1.5, cex.main = 2, col = color.vector, pch = symbol.vector)
>
> legend("topleft", col = c("purple", "red"), pch = c(25, 24), legend = c("Fungicide", "Control"))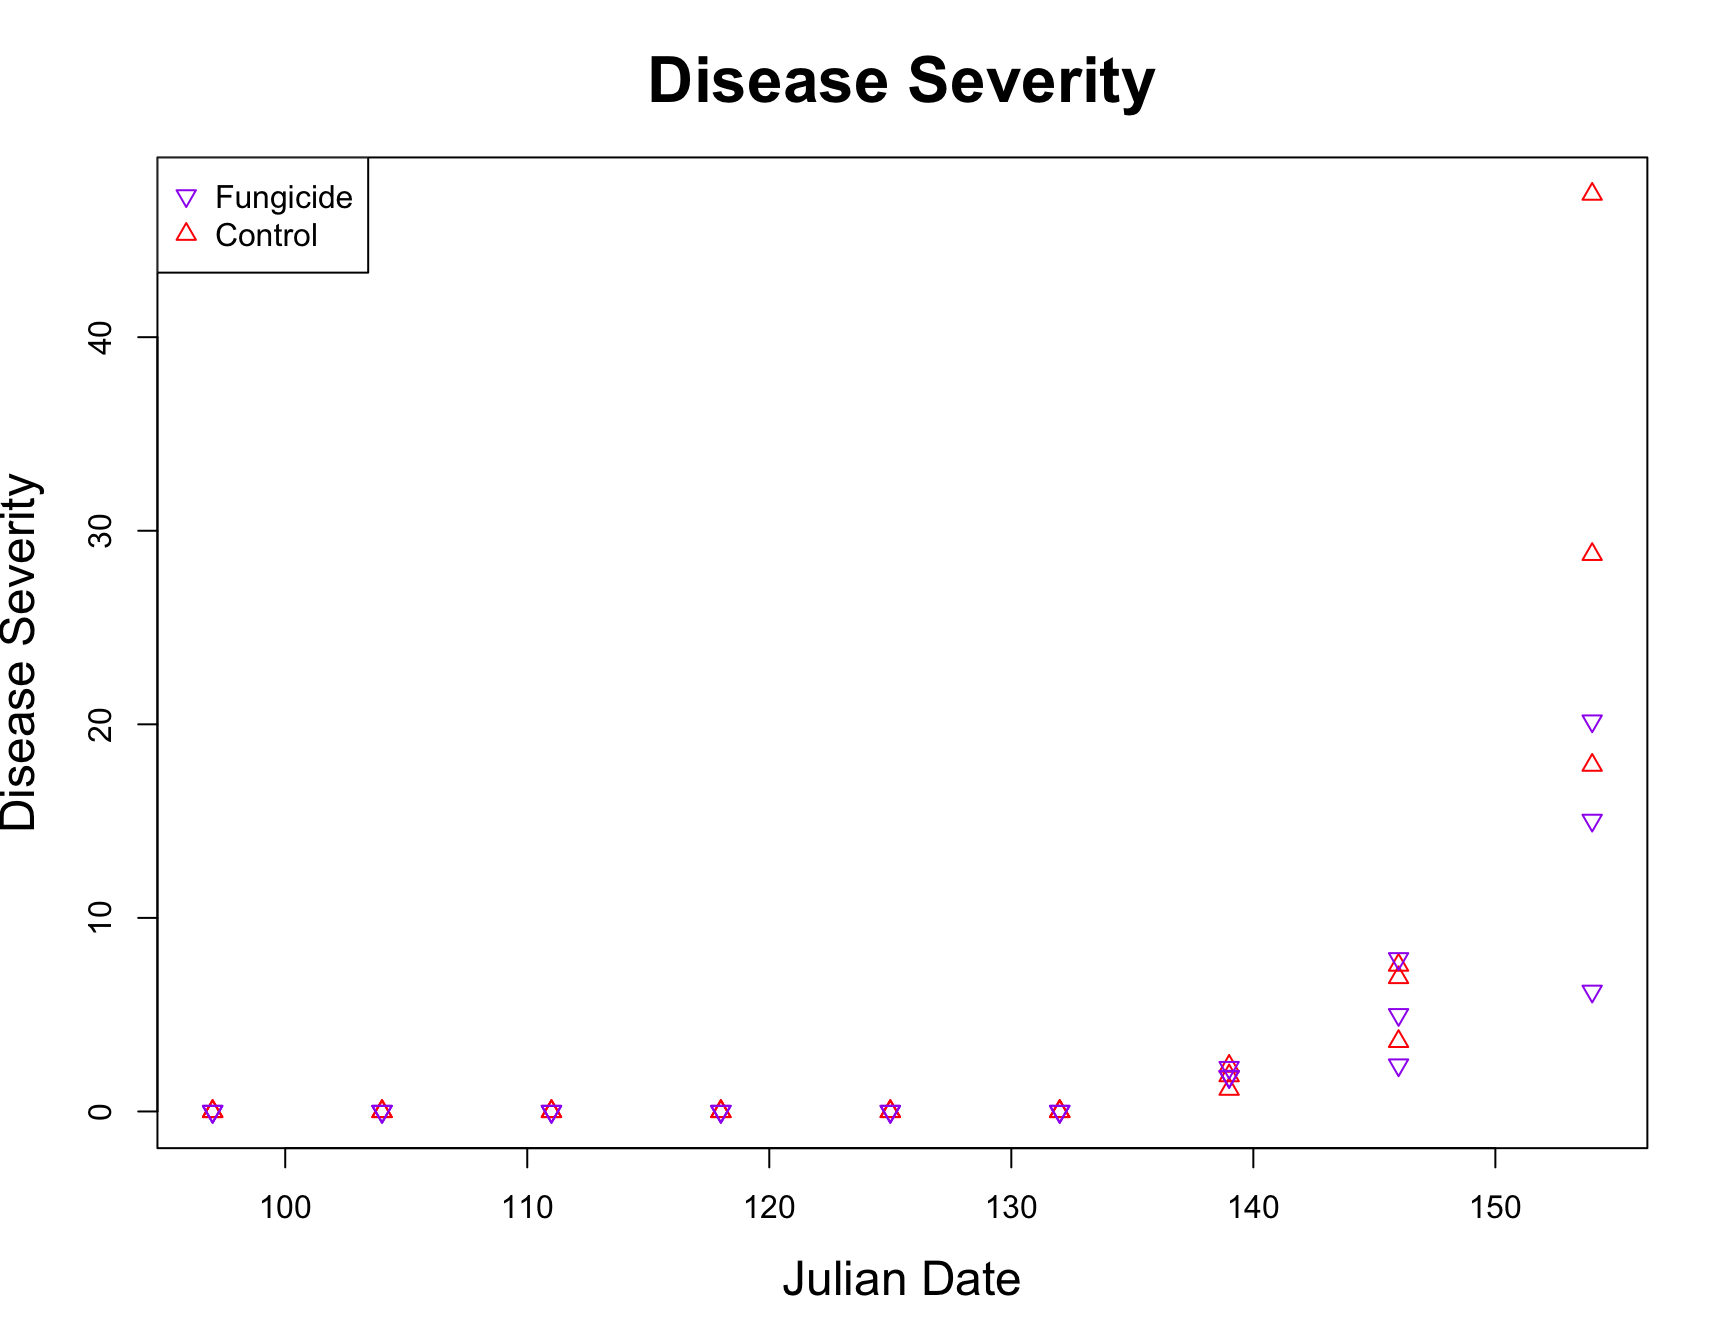
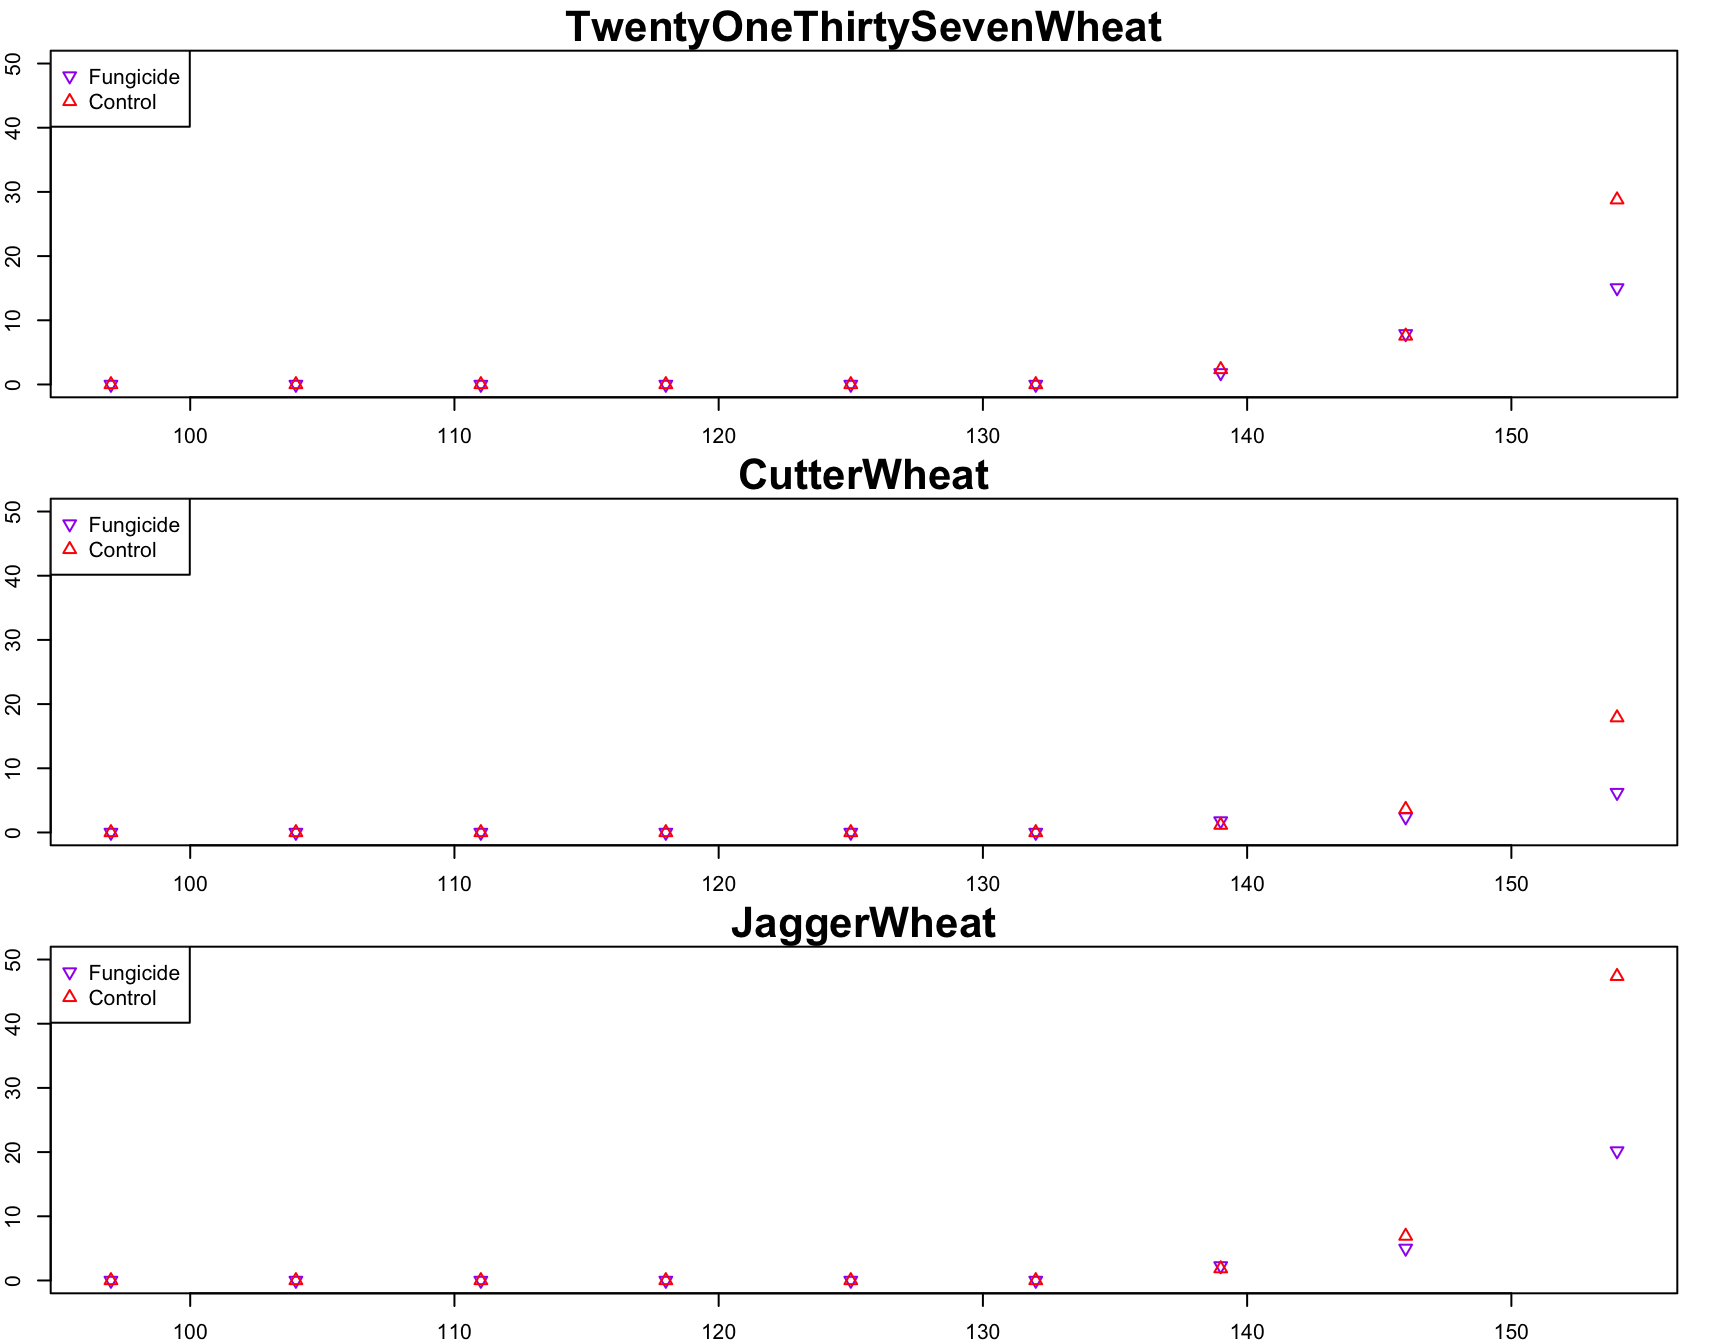
Making three plots, one for each cultivar
Create three separate data sets; one for each cultivar
> fungicide.tidy.TwentyOneThirtySevenWheat <- fungicide.tidy[which(fungicide.tidy$Cultivar == "TwentyOneThirtySevenWheat" ), ]
> fungicide.tidy.CutterWheat <- fungicide.tidy[which(fungicide.tidy$Cultivar == "CutterWheat"), ]
> fungicide.tidy.JaggerWheat <- fungicide.tidy[which(fungicide.tidy$Cultivar == "JaggerWheat"), ]
Create a vector for the dates
> jdate <- fungicide.tidy.TwentyOneThirtySevenWheat[which(fungicide.tidy.TwentyOneThirtySevenWheat$Experiment == "fungicide"), "Julian.Date"]Create vectors for each treatement and cultvar
> TwentyOneThirtySevenWheat.fungicide <- fungicide.tidy.TwentyOneThirtySevenWheat[which(fungicide.tidy.TwentyOneThirtySevenWheat$Experiment == "fungicide"), "Severity"]
> TwentyOneThirtySevenWheat.control <- fungicide.tidy.TwentyOneThirtySevenWheat[which(fungicide.tidy.TwentyOneThirtySevenWheat$Experiment == "control"), "Severity"]
> CutterWheat.fungicide <- fungicide.tidy.CutterWheat[which(fungicide.tidy.CutterWheat$Experiment == "fungicide"), "Severity"]
> CutterWheat.control <- fungicide.tidy.CutterWheat[which(fungicide.tidy.CutterWheat$Experiment == "control"), "Severity"]
> JaggerWheat.fungicide <- fungicide.tidy.JaggerWheat[which(fungicide.tidy.JaggerWheat$Experiment == "fungicide"), "Severity"]
> JaggerWheat.control <- fungicide.tidy.JaggerWheat[which(fungicide.tidy.JaggerWheat$Experiment == "control"), "Severity"]
>
> par(mfrow = c(3, 1),
+     mar = c(2, 2, 2, 2),
+     lab = c(5, 5, 7))
>
> plot(
+   TwentyOneThirtySevenWheat.fungicide ~ jdate,
+   xlab = "Julian Date",
+   ylab = "Disease Severity",
+   main = "TwentyOneThirtySevenWheat",
+   cex.lab = 1.5,
+   cex.main = 2,
+   col = "purple",
+   pch = 25,
+   ylim = c(0, 50)
+ )
>
> points(
+   TwentyOneThirtySevenWheat.control ~ jdate,
+   xlab = "Julian Date",
+   ylab = "Disease Severity",
+   main = "Control",
+   cex.lab = 1.5,
+   cex.main = 2,
+   col = "red",
+   pch = 24,
+   ylim = c(0, 50)
+ )
> legend(
+   "topleft",
+   col = c("purple", "red"),
+   pch = c(25, 24),
+   legend = c("Fungicide", "Control")
+ )
>
>
> plot(
+   CutterWheat.fungicide ~ jdate,
+   xlab = "Julian Date",
+   ylab = "Disease Severity",
+   main = "CutterWheat",
+   cex.lab = 1.5,
+   cex.main = 2,
+   col = "purple",
+   pch = 25,
+   ylim = c(0, 50)
+ )
> points(
+   CutterWheat.control ~ jdate,
+   xlab = "Julian Date",
+   ylab = "Disease Severity",
+   main = "Control",
+   cex.lab = 1.5,
+   cex.main = 2,
+   col = "red",
+   pch = 24,
+   ylim = c(0, 50)
+ )
> legend(
+   "topleft",
+   col = c("purple", "red"),
+   pch = c(25, 24),
+   legend = c("Fungicide", "Control")
+ )
>
>
>
> plot(
+   JaggerWheat.fungicide ~ jdate,
+   xlab = "Julian Date",
+   ylab = "Disease Severity",
+   main = "JaggerWheat",
+   cex.lab = 1.5,
+   cex.main = 2,
+   col = "purple",
+   pch = 25,
+   ylim = c(0, 50)
+ )
> points(
+   JaggerWheat.control ~ jdate,
+   xlab = "Julian Date",
+   ylab = "Disease Severity",
+   main = "Control",
+   cex.lab = 1.5,
+   cex.main = 2,
+   col = "red",
+   pch = 24,
+   ylim = c(0, 50)
+ )
> legend(
+   "topleft",
+   col = c("purple", "red"),
+   pch = c(25, 24),
+   legend = c("Fungicide", "Control")
+ )
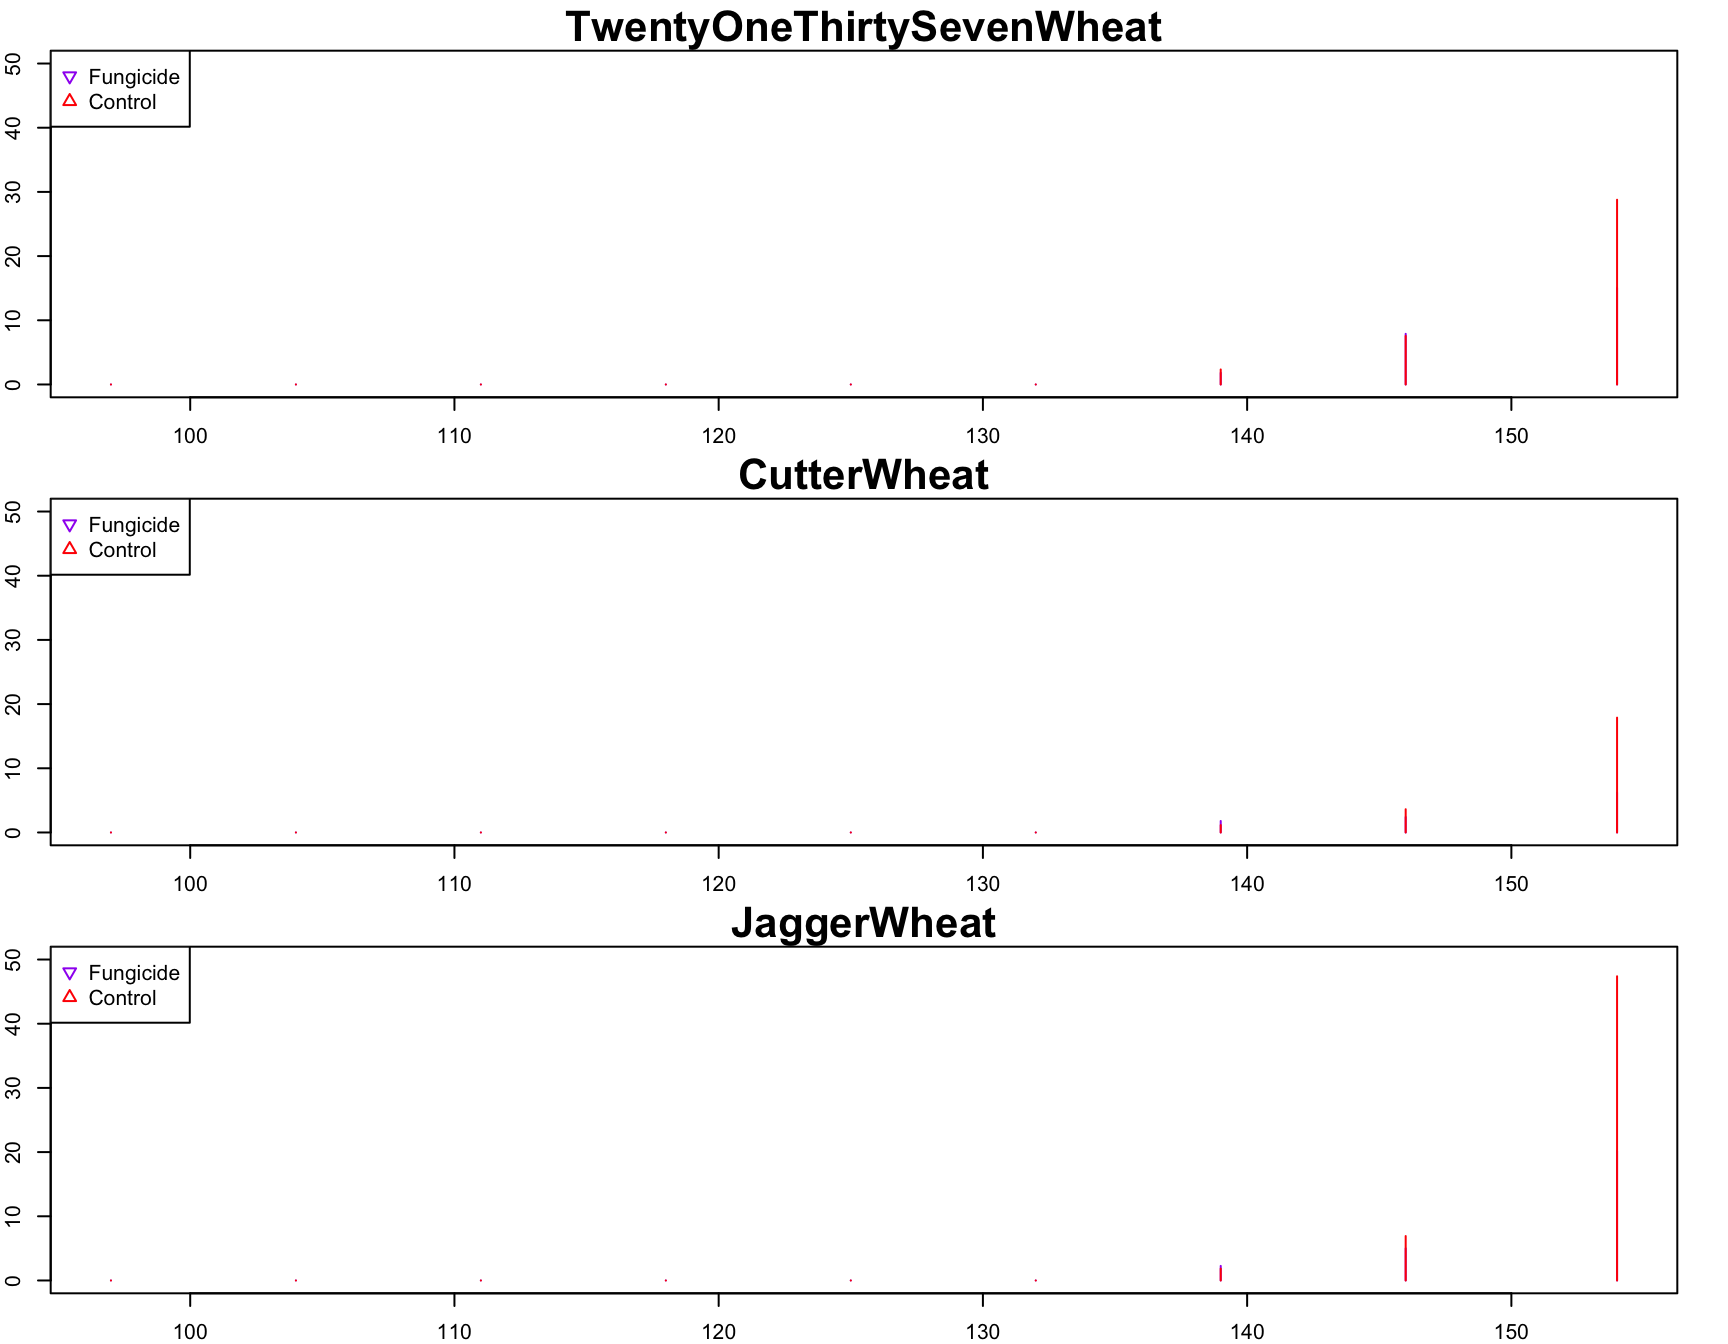
Change the symbols so that they are “histogram-like”
> par(mfrow = c(3, 1),
+     mar = c(2, 2, 2, 2),
+     lab = c(5, 5, 7))
>
>
> plot(
+   TwentyOneThirtySevenWheat.fungicide ~ jdate,
+   xlab = "Julian Date",
+   ylab = "Disease Severity",
+   main = "TwentyOneThirtySevenWheat",
+   cex.lab = 1.5,
+   cex.main = 2,
+   col = "purple",
+   pch = 25,
+   ylim = c(0, 50),
+   type = "h"
+ )
> lines(
+   TwentyOneThirtySevenWheat.control ~ jdate,
+   xlab = "Julian Date",
+   ylab = "Disease Severity",
+   main = "Control",
+   cex.lab = 1.5,
+   cex.main = 2,
+   col = "red",
+   pch = 24,
+   ylim = c(0, 50),
+   type = "h"
+ )
> legend(
+   "topleft",
+   col = c("purple", "red"),
+   pch = c(25, 24),
+   legend = c("Fungicide", "Control")
+ )
>
>
> plot(
+   CutterWheat.fungicide ~ jdate,
+   xlab = "Julian Date",
+   ylab = "Disease Severity",
+   main = "CutterWheat",
+   cex.lab = 1.5,
+   cex.main = 2,
+   col = "purple",
+   pch = 25,
+   ylim = c(0, 50),
+   type = "h"
+ )
> lines(
+   CutterWheat.control ~ jdate,
+   xlab = "Julian Date",
+   ylab = "Disease Severity",
+   main = "Control",
+   cex.lab = 1.5,
+   cex.main = 2,
+   col = "red",
+   pch = 24,
+   ylim = c(0, 50),
+   type = "h"
+ )
> legend(
+   "topleft",
+   col = c("purple", "red"),
+   pch = c(25, 24),
+   legend = c("Fungicide", "Control")
+ )
>
>
>
> plot(
+   JaggerWheat.fungicide ~ jdate,
+   xlab = "Julian Date",
+   ylab = "Disease Severity",
+   main = "JaggerWheat",
+   cex.lab = 1.5,
+   cex.main = 2,
+   col = "purple",
+   pch = 25,
+   ylim = c(0, 50),
+   type = "h"
+ )
> lines(
+   JaggerWheat.control ~ jdate,
+   xlab = "Julian Date",
+   ylab = "Disease Severity",
+   main = "Control",
+   cex.lab = 1.5,
+   cex.main = 2,
+   col = "red",
+   pch = 24,
+   ylim = c(0, 50),
+   type = "h"
+ )
> legend(
+   "topleft",
+   col = c("purple", "red"),
+   pch = c(25, 24),
+   legend = c("Fungicide", "Control")
+ )
Change the symbols to lines
> par(mfrow = c(3, 1),
+     mar = c(2, 2, 2, 2),
+     lab = c(5, 5, 7))
>
> plot(
+   TwentyOneThirtySevenWheat.fungicide ~ jdate,
+   xlab = "Julian Date",
+   ylab = "Disease Severity",
+   main = "TwentyOneThirtySevenWheat",
+   cex.lab = 1.5,
+   cex.main = 2,
+   col = "purple",
+   pch = 25,
+   ylim = c(0, 50),
+   type = "l"
+ )
> lines(
+   TwentyOneThirtySevenWheat.control ~ jdate,
+   xlab = "Julian Date",
+   ylab = "Disease Severity",
+   main = "Control",
+   cex.lab = 1.5,
+   cex.main = 2,
+   col = "red",
+   pch = 24,
+   ylim = c(0, 50),
+   type = "l"
+ )
> legend(
+   "topleft",
+   col = c("purple", "red"),
+   pch = c(25, 24),
+   legend = c("Fungicide", "Control")
+ )
>
>
> plot(
+   CutterWheat.fungicide ~ jdate,
+   xlab = "Julian Date",
+   ylab = "Disease Severity",
+   main = "CutterWheat",
+   cex.lab = 1.5,
+   cex.main = 2,
+   col = "purple",
+   pch = 25,
+   ylim = c(0, 50),
+   type = "l"
+ )
> lines(
+   CutterWheat.control ~ jdate,
+   xlab = "Julian Date",
+   ylab = "Disease Severity",
+   main = "Control",
+   cex.lab = 1.5,
+   cex.main = 2,
+   col = "red",
+   pch = 24,
+   ylim = c(0, 50),
+   type = "l"
+ )
> legend(
+   "topleft",
+   col = c("purple", "red"),
+   pch = c(25, 24),
+   legend = c("Fungicide", "Control")
+ )
>
>
>
> plot(
+   JaggerWheat.fungicide ~ jdate,
+   xlab = "Julian Date",
+   ylab = "Disease Severity",
+   main = "JaggerWheat",
+   cex.lab = 1.5,
+   cex.main = 2,
+   col = "purple",
+   pch = 25,
+   ylim = c(0, 50),
+   type = "l"
+ )
> lines(
+   JaggerWheat.control ~ jdate,
+   xlab = "Julian Date",
+   ylab = "Disease Severity",
+   main = "Control",
+   cex.lab = 1.5,
+   cex.main = 2,
+   col = "red",
+   pch = 24,
+   ylim = c(0, 50),
+   type = "l"
+ )
> legend(
+   "topleft",
+   col = c("purple", "red"),
+   pch = c(25, 24),
+   legend = c("Fungicide", "Control")
+ )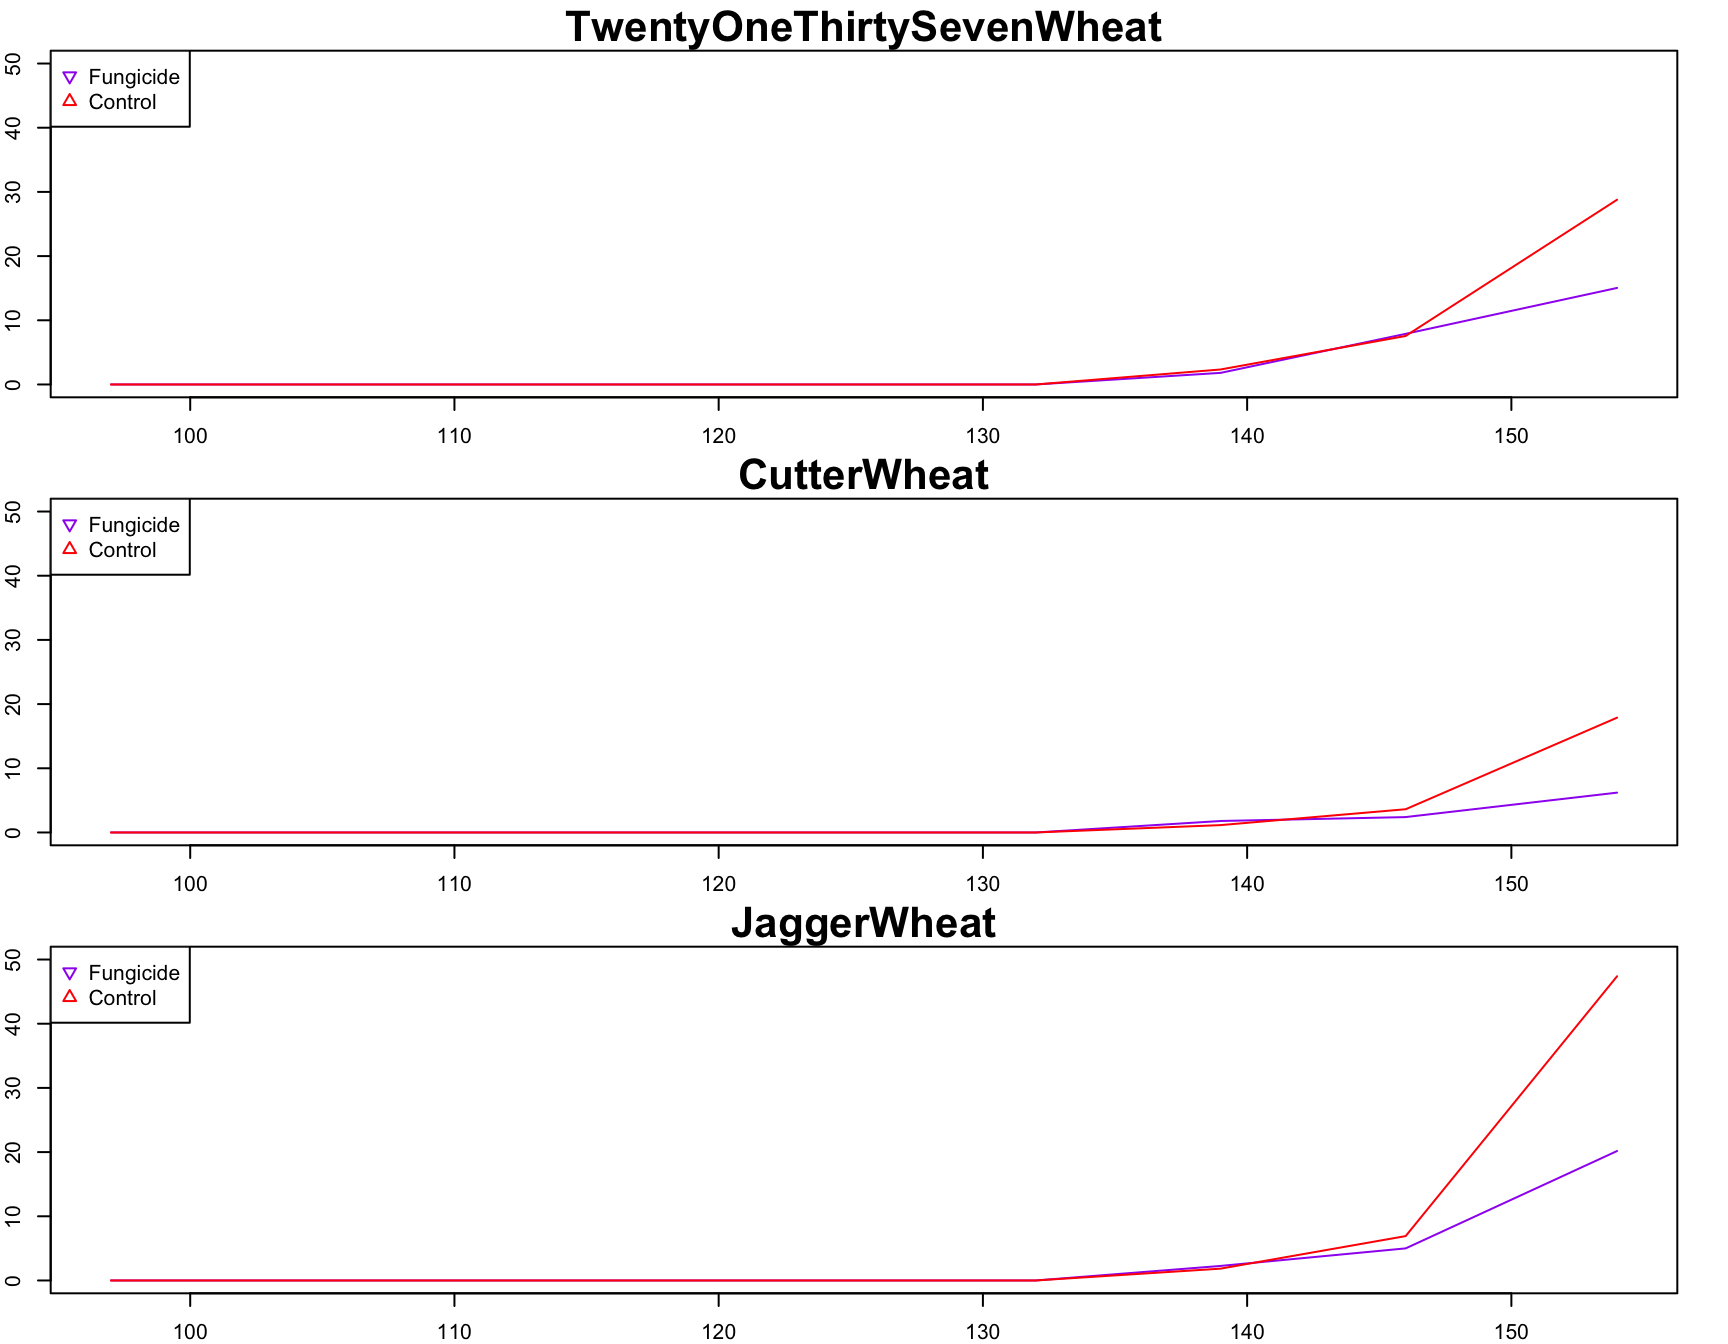
Change the symbols to points and lines
> pdf("results/Disease.Severity.Fungicide.vs.Control.pdf", width = 8)
> par(mfrow = c(3, 1),
+     mar = c(5, 5, 5, 5),
+     lab = c(5, 5, 7))
>
> plot(
+   TwentyOneThirtySevenWheat.fungicide ~ jdate,
+   xlab = "Julian Date",
+   ylab = "Disease Severity",
+   main = "TwentyOneThirtySevenWheat",
+   cex.lab = 1.5,
+   cex.main = 2,
+   col = "purple",
+   pch = 25,
+   ylim = c(0, 50),
+   type = "b"
+ )
> lines(
+   TwentyOneThirtySevenWheat.control ~ jdate,
+   xlab = "Julian Date",
+   ylab = "Disease Severity",
+   main = "Control",
+   cex.lab = 1.5,
+   cex.main = 2,
+   col = "red",
+   pch = 24,
+   ylim = c(0, 50),
+   type = "b"
+ )
> legend(
+   "topleft",
+   col = c("purple", "red"),
+   pch = c(25, 24),
+   legend = c("Fungicide", "Control")
+ )
>
>
> plot(
+   CutterWheat.fungicide ~ jdate,
+   xlab = "Julian Date",
+   ylab = "Disease Severity",
+   main = "CutterWheat",
+   cex.lab = 1.5,
+   cex.main = 2,
+   col = "purple",
+   pch = 25,
+   ylim = c(0, 50),
+   type = "b"
+ )
> lines(
+   CutterWheat.control ~ jdate,
+   xlab = "Julian Date",
+   ylab = "Disease Severity",
+   main = "Control",
+   cex.lab = 1.5,
+   cex.main = 2,
+   col = "red",
+   pch = 24,
+   ylim = c(0, 50),
+   type = "b"
+ )
> legend(
+   "topleft",
+   col = c("purple", "red"),
+   pch = c(25, 24),
+   legend = c("Fungicide", "Control")
+ )
>
>
>
> plot(
+   JaggerWheat.fungicide ~ jdate,
+   xlab = "Julian Date",
+   ylab = "Disease Severity",
+   main = "JaggerWheat",
+   cex.lab = 1.5,
+   cex.main = 2,
+   col = "purple",
+   pch = 25,
+   ylim = c(0, 50),
+   type = "b"
+ )
> lines(
+   JaggerWheat.control ~ jdate,
+   xlab = "Julian Date",
+   ylab = "Disease Severity",
+   main = "Control",
+   cex.lab = 1.5,
+   cex.main = 2,
+   col = "red",
+   pch = 24,
+   ylim = c(0, 50),
+   type = "b"
+ )
> legend(
+   "topleft",
+   col = c("purple", "red"),
+   pch = c(25, 24),
+   legend = c("Fungicide", "Control")
+ )
>
> dev.off()
quartz_off_screen
2 Reset par at the end so that none of the bells and whistles specified in previous graphs are carried foward to the next graph
> par()$xlog
[1] FALSE
$ylog
[1] FALSE
$adj
[1] 0.5
$ann
[1] TRUE
$ask
[1] FALSE
$bg
[1] "white"
$bty
[1] "o"
$cex
[1] 1
$cex.axis
[1] 1
$cex.lab
[1] 1
$cex.main
[1] 1.2
$cex.sub
[1] 1
$cin
[1] 0.15 0.20
$col
[1] "black"
$col.axis
[1] "black"
$col.lab
[1] "black"
$col.main
[1] "black"
$col.sub
[1] "black"
$cra
[1] 10.8 14.4
$crt
[1] 0
$csi
[1] 0.2
$cxy
[1] 0.01932990 0.03875969
$din
[1] 9 7
$err
[1] 0
$family
[1] ""
$fg
[1] "black"
$fig
[1] 0 1 0 1
$fin
[1] 9 7
$font
[1] 1
$font.axis
[1] 1
$font.lab
[1] 1
$font.main
[1] 2
$font.sub
[1] 1
$lab
[1] 5 5 7
$las
[1] 0
$lend
[1] "round"
$lheight
[1] 1
$ljoin
[1] "round"
$lmitre
[1] 10
$lty
[1] "solid"
$lwd
[1] 1
$mai
[1] 1.02 0.82 0.82 0.42
$mar
[1] 5.1 4.1 4.1 2.1
$mex
[1] 1
$mfcol
[1] 1 1
$mfg
[1] 1 1 1 1
$mfrow
[1] 1 1
$mgp
[1] 3 1 0
$mkh
[1] 0.001
$new
[1] FALSE
$oma
[1] 0 0 0 0
$omd
[1] 0 1 0 1
$omi
[1] 0 0 0 0
$page
[1] TRUE
$pch
[1] 1
$pin
[1] 7.76 5.16
$plt
[1] 0.09111111 0.95333333 0.14571429 0.88285714
$ps
[1] 12
$pty
[1] "m"
$smo
[1] 1
$srt
[1] 0
$tck
[1] NA
$tcl
[1] -0.5
$usr
[1] 0 1 0 1
$xaxp
[1] 0 1 5
$xaxs
[1] "r"
$xaxt
[1] "s"
$xpd
[1] FALSE
$yaxp
[1] 0 1 5
$yaxs
[1] "r"
$yaxt
[1] "s"
$ylbias
[1] 0.2
This work is licensed under a Creative Commons Attribution-ShareAlike 4.0 International License.